Market Momentum Explains 69.4% of InnoDexis Score Variance as 100 High-Disruption, Low-Momentum Records Independently Replicate the TRL 5 Trough Identified in the Readiness Report
A field audit of four proprietary competitive assessments finds they are compositionally related rather than independent, that crossing momentum against disruption produces four quadrants with sharply different readiness profiles, and that service and relationship positioning at 4.78 is the most reliable negative marker in the competitive field group.
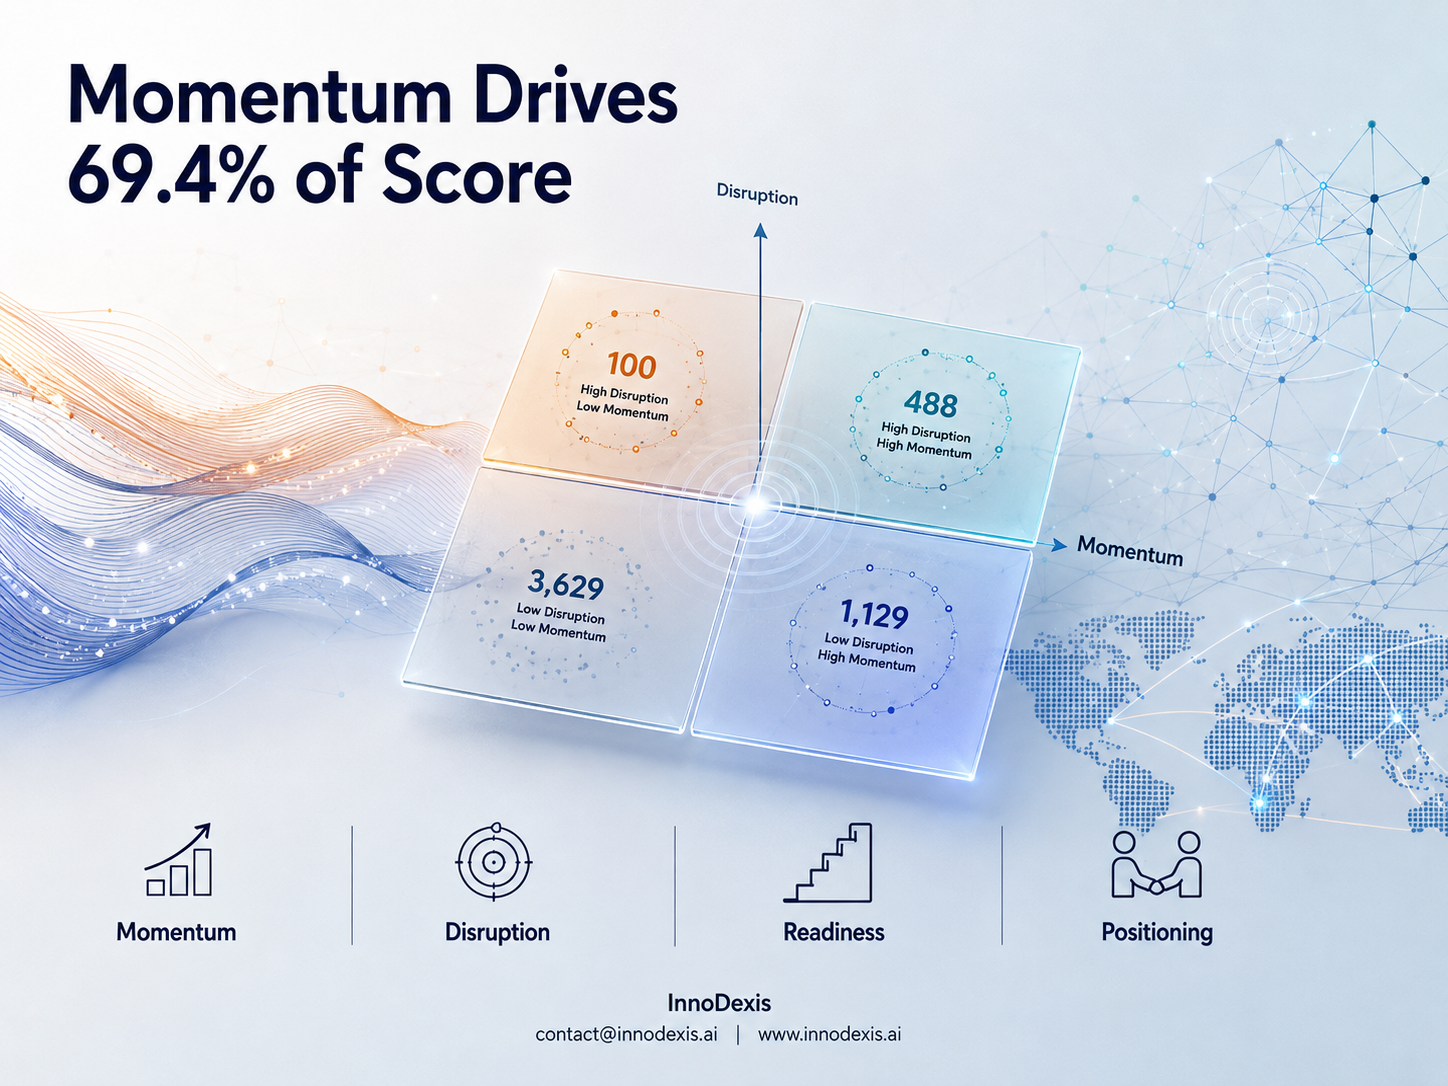
InnoDexis has published its latest Corporate Intelligence Report — Now or Later — auditing and applying the four proprietary competitive assessment fields across 5,346 valid Corporate-stream records during July 2026. The report reveals that market momentum alone explains 69.4% of the variance in the InnoDexis Score, that momentum and disruption together explain 79.3%, and that the 100-record cohort of high-disruption, low-momentum announcements carries a median Technology Readiness Level of 5 — independently replicating the mid-ladder trough documented in the July 2026 Ladder report from a completely separate field group.
Key Findings
The audit of proprietary field independence is the report's foundational finding and constrains everything that follows. A linear model using only market momentum and disruption potential as ordinal inputs reproduces 79.3% of the variance in the InnoDexis Score, with coefficients of 1.59 per momentum step and 1.25 per disruption step on a base of 2.68. Records rated Low momentum average 2.61, Medium 5.39, and High 7.36 — a spread of 4.75 points across a ten-point scale, wider than any other field relationship identified across the July report series by a factor of nearly three. The report concludes that the three fields carry roughly one field's worth of independent information and cannot corroborate one another, while noting that the 20.7% of unexplained variance confirms the score does carry information beyond the two ordinals — records at identical momentum and disruption ratings still differ by approximately one point in each direction.
The four competitive quadrants produced by crossing momentum against disruption each carry a structurally distinct profile. The largest quadrant — 3,629 records at 67.9% of the corpus — rates neither signal high, averaging 4.69 at median TRL 9. The high-momentum, lower-disruption quadrant holds 1,129 records averaging 7.10 at median TRL 9, representing competitive product launches and commercial wins in existing categories where revenue is visibly being competed for now. The high-disruption, high-momentum quadrant holds 488 records at a mean score of 7.98 and median TRL 8 — technology assessed as both consequential and already moving, at just short of full deployment. The smallest quadrant — 100 records — rates disruption high and momentum lower, scoring 6.64 with a median TRL of 5.
The 100-record high-disruption, low-momentum quadrant independently replicates the TRL 5 scarcity finding from the July 2026 Ladder report, derived from a completely separate field group. The readiness report established that TRL 5 is the scarcest rung in both streams and the point at which laboratory validation must become operational demonstration. The competitive quadrant locates the same population by a different route — technology assessed as disruptive by companies whose market has not yet begun to move. The report is explicit that the convergence was not engineered, the quadrant was constructed before the TRL medians were computed, and at 100 records and one month this establishes a hypothesis rather than a confirmed result requiring replication in August before external use.
Energy and Utilities leads all sectors on high-momentum share at 50.6%, followed by Telecommunications at 50.0% and Aerospace and Defense at 46.7%. The report identifies capital-intensive infrastructure build cycles as the structural explanation — grid capacity, network densification, and multi-year defence appropriations generate committed capital that registers as momentum regardless of quarterly sentiment. Education at 11.1% and Media and Entertainment at 13.7% sit at the bottom of the sector momentum table. Both appeared in the July market report as net consumers of innovation with the highest target-to-supplier ratios — sectors that do not build their own technology also do not generate their own momentum signals, and the two findings describe the same asymmetry from opposite ends.
Companies stating any competitive position score 5.71 against 4.95 for those that do not. Technical differentiation leads the positioning claim taxonomy at 6.32, followed by superlative and category-defining claims at 6.20. Superlative claims — including firsts, onlys, and world-leading assertions — average 6.09 when stated alone against 5.43 for records making no classifiable claim. The report attributes this to falsifiability: a claim of first regulatory approval in a category or only production facility of its type in a region is a statement a competitor could publicly contradict, and the data suggests that accountability is priced accordingly. Service and relationship positioning at 4.78 is the lowest-scoring positioning claim type and the most reliable negative marker in the competitive field group.
Strategic Insight and Trend Analysis
The most consequential finding of the Now or Later report is the audit result establishing that market momentum, disruption potential, and the InnoDexis Score are compositionally related rather than independent measurements. This matters analytically because five reports earlier in the July series cited agreement between these fields as corroborating evidence, and that interpretation is not supportable. The report explicitly identifies all prior external validation in the series as remaining sound precisely because it was conducted against fields outside this group — product type, readiness level, speaker role, and partnership type — and notes that internal agreement within the three-field group is circular rather than confirmatory.
The quadrant analysis is the primary constructive output enabled by the audit finding. Because momentum and disruption correlate at 0.635 rather than 1.0, genuine disagreement between them is meaningful rather than noise, and the four quadrants it produces answer a question neither field alone can address: is this happening now or will it matter later? The high-momentum, lower-disruption quadrant answers the first question at 1,129 records. The high-disruption, low-momentum quadrant answers the second at 100 records. The 488-record both-high quadrant identifies technology that is simultaneously consequential and already moving at median TRL 8 — the competitive threat segment for any organisation monitoring the current cycle.
The five spotlight records from the disruption quadrant illustrate a structural property the momentum signal systematically misses. Evonik's DURAION anion-conducting membrane, ITEN's solid-state surface-mount battery, and Fraunhofer ILT's EHLA coating process each serve another manufacturer rather than an end customer — input-layer technologies whose market effect is two or three steps downstream from any movement visible in current market data. The KAIST APT-RL quadruped control system illustrates a second failure mode: the capability exists and no named application, pilot customer, or commercial partner appears in the announcement. Both failure modes are structural properties of the momentum signal rather than judgements about the underlying technology, and both cause the materials and deep-tech layer to be persistently under-weighted by any momentum-ranked analysis.
Global and Industry Implications
For corporates and R&D teams, the four-quadrant navigation framework provides a directly actionable horizon filter across the Corporate stream. The 488-record both-high quadrant at score 7.98 and median TRL 8 is the competitive threat segment for monitoring over a one-to-two year horizon — technology that is both assessed as consequential and already moving, at just short of full deployment. The 100-record high-disruption, low-momentum cohort is the early-warning segment requiring a longer horizon to act on, where the transition signal to watch is a single named commercial partner or pilot customer — the event that moves a record between quadrants without anything about the underlying technology having changed. The EHLA process technology from Fraunhofer ILT at commissioned series production with a first industrial customer exemplifies this transition: a second named customer in a different sector — hydraulics, rail, offshore — would move the record from the disruption quadrant to both-high, and that event is observable in this stream before any market indicator registers it.
For investors and capital allocators, the 100-record high-disruption, low-momentum cohort at median TRL 5 is identified as the earliest actionable segment the Corporate stream produces — the cohort screening on momentum will exclude by construction. The report is explicit that this is the correct filter for long-horizon capital and the wrong one for one-to-two year competitive monitoring, and that the quadrant is only useful once the investment horizon is specified. The LLNL and Pacific Fusion pulsed power record illustrates the extremity of the position: high disruption is uncontroversial for a working fusion driver, and low momentum is equally uncontroversial because there is no fusion market to have momentum in. The two assessments are answering genuinely different questions, and their disagreement is informative rather than contradictory.
For policymakers and national innovation bodies, the structural suppression of input-layer technologies by the momentum signal — confirmed across Evonik's membrane chemistry, ITEN's battery architecture, and Fraunhofer ILT's coating process, all serving manufacturers rather than end customers — identifies a systematic gap in any market-signal-driven technology monitoring framework. Advanced materials, components, and process technologies will be persistently under-weighted relative to their strategic significance in any momentum-ranked view, because their market is another manufacturer whose own market movement is a further step removed. The report recommends investigating whether the momentum signal's treatment of input-layer technologies constitutes a confirmable and correctable bias — if confirmed, remediation would restore visibility to precisely the deep-tech segment that national industrial strategy programmes most consistently identify as a strategic priority.
InnoDexis Statement
"The hundred records that register disruption without momentum are the reason this platform exists — and the audit finding that confirms momentum and the score are compositionally related, rather than independent, is the finding that makes it possible to use those hundred records correctly," noted InnoDexis in its latest intelligence report.
Conclusion
The Now or Later report establishes that the three proprietary competitive assessment fields are compositionally related rather than independent, that their agreement cannot serve as corroborating evidence and all valid corroboration in the July series rests on fields outside this group, and that crossing momentum against disruption produces four quadrants with structurally distinct readiness profiles — including a 100-record high-disruption, low-momentum cohort at median TRL 5 that independently replicates the mid-ladder trough identified in the Ladder report from a completely separate field group. Across 5,346 valid Corporate-stream records, the evidence confirms a 4.75-point momentum band spread, an Energy and Utilities sector leading all sectors on momentum share at 50.6%, and a service and relationship positioning claim type at 4.78 as the most reliable negative marker in the competitive field group. As the four quadrants are re-derived in August and September, the input-layer momentum bias is investigated for correctability, and the schema documentation is updated to reflect the compositional relationship between the three proprietary fields, the competitive intelligence framework will provide the most structurally honest and analytically precise competitive segmentation the InnoDexis platform has yet produced. The complete Now or Later Competitive Intelligence July 2026 Report is available to InnoDexis subscribers and enterprise clients.
About InnoDexis
InnoDexis is a global Innovation Intelligence platform that tracks, analyzes, and interprets breakthrough innovations, prototypes, and emerging technologies across industries and countries. Its intelligence helps corporates, investors, and policymakers understand the true structure and direction of global innovation. Learn more at innodexis.ai.