4,483 Organisations Across 1,084 Disconnected Components Confirm One Month of Partnership Data Cannot Build a Network as Joint Ventures Score 6.94 Against a 5.52 Stream Mean
A graph analysis of 2,495 July 2026 partnership records finds that 59.8% of organisations appear with exactly one partner, that Google holds a betweenness centrality of 0.65 as the dominant single-month broker, and that cross-sector links account for 23.7% of all partnership connections.
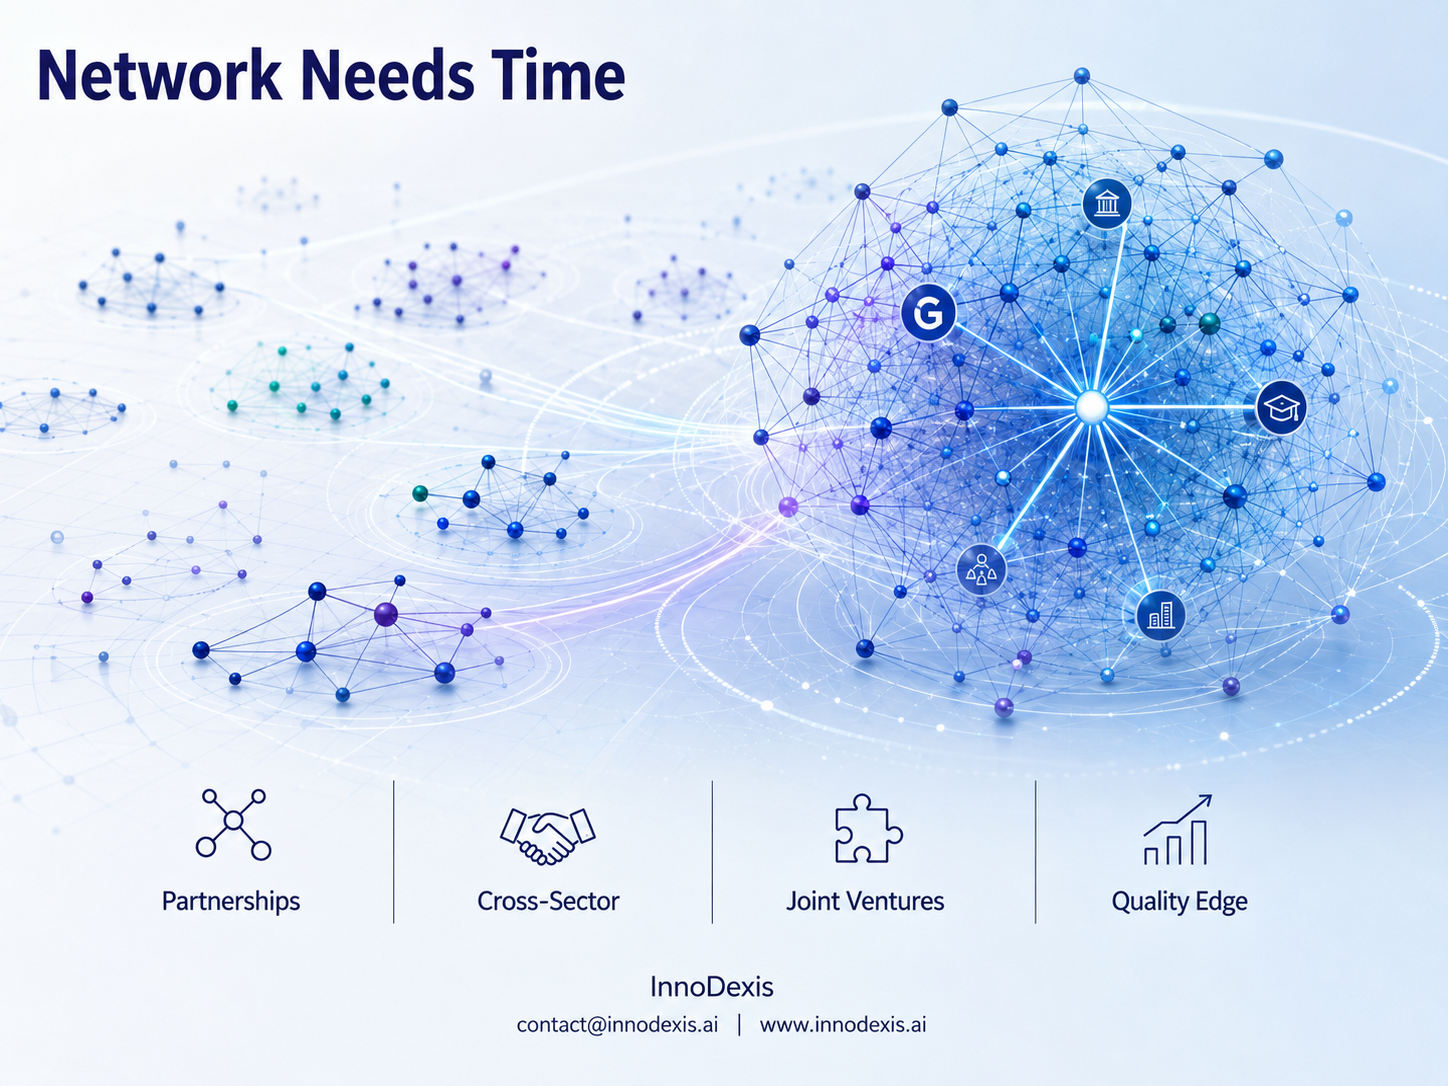
InnoDexis has published its latest Corporate Intelligence Report — Who Partners With Whom — analyzing 2,495 partnership records extracted from 5,529 valid Corporate-stream records during July 2026, producing a network of 4,483 named organisations connected by 4,399 filtered partnership links. The report reveals that the 4,483 organisations divide into 1,084 separate components — confirming that a single month of data does not produce a connected network — that joint ventures lead all partnership types at a mean InnoDexis score of 6.94 against a stream mean of 5.52, and that partnership type is a field whose 930 distinct raw values require canonical mapping before it can be used as a filter or facet.
Key Findings
The network's fragmentation is the report's central finding. Of 1,084 separate components, 529 are simple two-party pairs connected to nothing else in the month's data, and a further 414 contain three to five organisations — together accounting for 943 of 1,084 components and 2,552 of 4,483 organisations. Mean degree is 1.96 and median degree is 1. Nearly 60% of organisations appear with exactly one partner, 6.6% have five or more, and graph density is 0.000438. The report is explicit that this is not a data quality problem — it is what monthly partnership announcements structurally look like: a very large number of small unconnected commitments plus a thin connective tissue running through a handful of platform companies.
The largest connected component contains 391 organisations and 458 links but is stringy rather than dense. Its diameter is 20 and its average shortest path is 7.59, meaning two randomly chosen members are typically separated by seven or eight intermediaries — against three or four in a well-connected business network. The component contains 97 articulation points representing 24.8% of its membership — organisations whose removal would split it into disconnected pieces. Google leads all organisations on betweenness centrality at 0.65, roughly double the next-ranked organisation, followed by Amazon, Microsoft, Google Cloud, Anthropic, and NetApp. The report identifies these positions as a property of one month of announcements rather than a structural claim about the innovation economy and explicitly cautions against external citation of these figures before a multi-month accumulation is available.
Partnership type carries a clean quality gradient once canonical mapping is applied. Joint ventures lead at 6.94, followed by technology integrations at 6.89, investments at 6.86, and R&D collaborations at 6.73 — all more than a point above the stream mean of 5.52. Sponsorship and community partnerships score 4.64 and licensing 5.38. The report identifies structural commitment as the discriminating factor: the four highest-scoring types involve two organisations committing resources to build something neither could build alone, while the lower-scoring types involve one organisation paying another for access, distribution, or visibility.
Cross-sector links — any partnership joining organisations from different institutional sectors — account for 23.7% of all partnership connections. Companies account for 83.6% of network organisations, academic and research bodies 11.2%, and government or public entities 5.2%. Academic-corporate links account for 12.9% of links and corporate-government links 8.8%. Research and public-sector organisations appear somewhat more frequently in connected structures than in isolated pairs, consistent with them acting as shared partners across multiple companies rather than as one-off counterparties. The report identifies cross-sector links as the highest-value partnership subset for innovation intelligence, since they represent where research capability meets commercial capacity and are least likely to be visible in any single data source.
The partnership_type field contains 930 distinct raw values across 2,054 populated records — a ratio of approximately one new label for every two records. Case variants, abbreviation variants, and near-synonyms with no evident distinction appear alongside each other. The ten-class canonical mapping applied in this report reduces these to R&D Collaboration, Technology Integration, Joint Venture, Licensing, Investment, Public-Private and Government, Distribution and Commercial, Strategic Alliance, Sponsorship and Community, and an Other bucket — leaving 14.3% of records unclassified. The report recommends extending the canonical mapping approach already applied to announcement_type to partnership_type before the field is used as a facet or filter in any product surface.
Announcements naming any partner at all score 5.99 against 5.23 for those naming none — a 0.76-point differential that the report identifies as the fifth distinct quality gradient documented across the July 2026 report series, consistent with the four preceding ones in pointing toward a segment of the stream that headline volume does not favour.
Strategic Insight and Trend Analysis
The most consequential structural finding of the Who Partners With Whom report is architectural rather than analytical. Partnership connectivity is an accumulating property of observation windows, not an observable monthly one. The 1,084 components visible in July 2026 are not evidence of a fragmented innovation ecosystem — they are evidence that one month is too short a window to reveal the paths that connect organisations through intermediaries. Twelve months of the same data would connect a substantial share of the current components as shared partners appear across windows; one month structurally cannot. The practical implication is that InnoGraph partnership network features must be built on cumulatively persisted edge data with announcement dates as attributes, not rebuilt per reporting period.
The five structural cases illustrate the range of what the network is made of. The NSF Regional Innovation Engines programme is the exact inverse of the month's dominant fragmentation pattern — a deliberate engineering of multi-party cross-sector connectivity across twelve teams in twenty states, designed to create the clusters this data shows do not arise organically at any useful rate within a single window. The Saronic Port Alpha anchor-tenant model demonstrates how a single large private commitment pulls public and educational partners into orbit around it, with workforce and educational partners at TRL 4 signalling that skilled labour rather than capital or technology is the expected binding constraint. The Sophia Space, Caltech, and JPL joint patent — a three-party structure joining a company, a university, and a federal laboratory around a shared IP asset — is structurally rare in this data and identified as disproportionately consequential because each participant supplies something the others structurally cannot.
The Synopsys and NVIDIA technology integration for agentic chip design workflows provides the corrective to reading fragmentation as insignificance. As a two-node pair — the most common and least visually interesting structural form — it would rank near the bottom of any degree-weighted network analysis while concerning how semiconductors will be designed and propagating its consequences to every customer of either firm.
Global and Industry Implications
For corporates and R&D teams, the 23.7% cross-sector link share and the 12.9% academic-corporate sub-share identify the specific partnership category where research capability is already demonstrably willing to work with industry and where the resulting announcements are least likely to be captured by any single monitoring source. The Guardián Forestal, Michoacán government, and major avocado exporter coalition — reaching 90% coverage of Mexican avocados exported to the United States within two years through satellite-verified deforestation certification — provides a directly replicable coalition assembly template for any commodity where deforestation risk and a concentrated buyer set coexist. The report identifies the binding constraint as coalition assembly rather than technology, and the template as transferable to cocoa, palm oil, coffee, and beef supply chains where the same structural conditions apply.
For investors and capital allocators, the four highest-scoring canonical partnership types — joint ventures at 6.94, technology integrations at 6.89, investments at 6.86, and R&D collaborations at 6.73 — provide a directly actionable quality filter available on 37.1% of the Corporate stream once canonical mapping is applied. The report identifies structural commitment as the discriminating mechanism: partnership types requiring two organisations to build something neither could build alone consistently score above 6.7 against a stream mean of 5.52, while access, distribution, and visibility arrangements do not. The Google betweenness centrality figure of 0.65 is explicitly identified as a single-month artefact requiring multi-month accumulation before it carries any weight as a structural claim about platform brokerage in the innovation economy.
For policymakers and national innovation bodies, the NSF Regional Innovation Engines programme is identified as a natural experiment in deliberately engineered cluster formation whose effects are directly measurable in this data. If the programme succeeds, organisations named in the Engines should appear in progressively larger connected components over coming years, with each Engine itself as an articulation point. The cross-sector link rate of 23.7% is identified as the metric most worth tracking over multiple years as a measure of actual permeability between research, government, and industry — unlike research output or patent counts, it cannot be inflated by any single participant acting alone and therefore provides a more reliable structural signal than the indicators currently used in most national innovation benchmarking frameworks.
InnoDexis Statement
"One month of partnership data shows 1,084 disconnected fragments — not because the innovation ecosystem is fragmented, but because the graph that connects it is longer than any single monthly window can reveal, and building network intelligence on it requires accumulation, not aggregation," noted InnoDexis in its latest intelligence report.
Conclusion
The Who Partners With Whom report establishes that monthly partnership announcement data is structurally insufficient to build a connected network, that the connectivity required for partnership graph features emerges only through cumulative observation window stacking, and that the five structural cases spanning engineered cluster formation, anchor-tenant public-private investment, three-party federal-academic-commercial IP, bilateral platform technology integration, and satellite-verified supply-chain coalition each illustrate a different way organisations combine that degree-weighted network analysis would systematically misrank. Across 2,495 partnership records producing 4,483 networked organisations and 4,399 filtered links, the evidence confirms a partnership type quality gradient spanning 2.30 points from joint ventures to sponsorship, a 23.7% cross-sector link share as the highest-value sourcing segment, and a taxonomy drift problem requiring canonical mapping before the field becomes analytically usable. As partnership edges are persisted cumulatively in InnoGraph, the component-merge rate is tracked across consecutive monthly cycles, and entity resolution is applied against a canonical organisation registry, the Who Partners With Whom framework will provide the most structurally precise partnership intelligence the InnoDexis platform has yet produced. The complete Who Partners With Whom July 2026 Report is available to InnoDexis subscribers and enterprise clients.
About InnoDexis
InnoDexis is a global Innovation Intelligence platform that tracks, analyzes, and interprets breakthrough innovations, prototypes, and emerging technologies across industries and countries. Its intelligence helps corporates, investors, and policymakers understand the true structure and direction of global innovation. Learn more at innodexis.ai.